Capability 01
Task Planning
Distribute tasks over time and instantly see the full project picture.
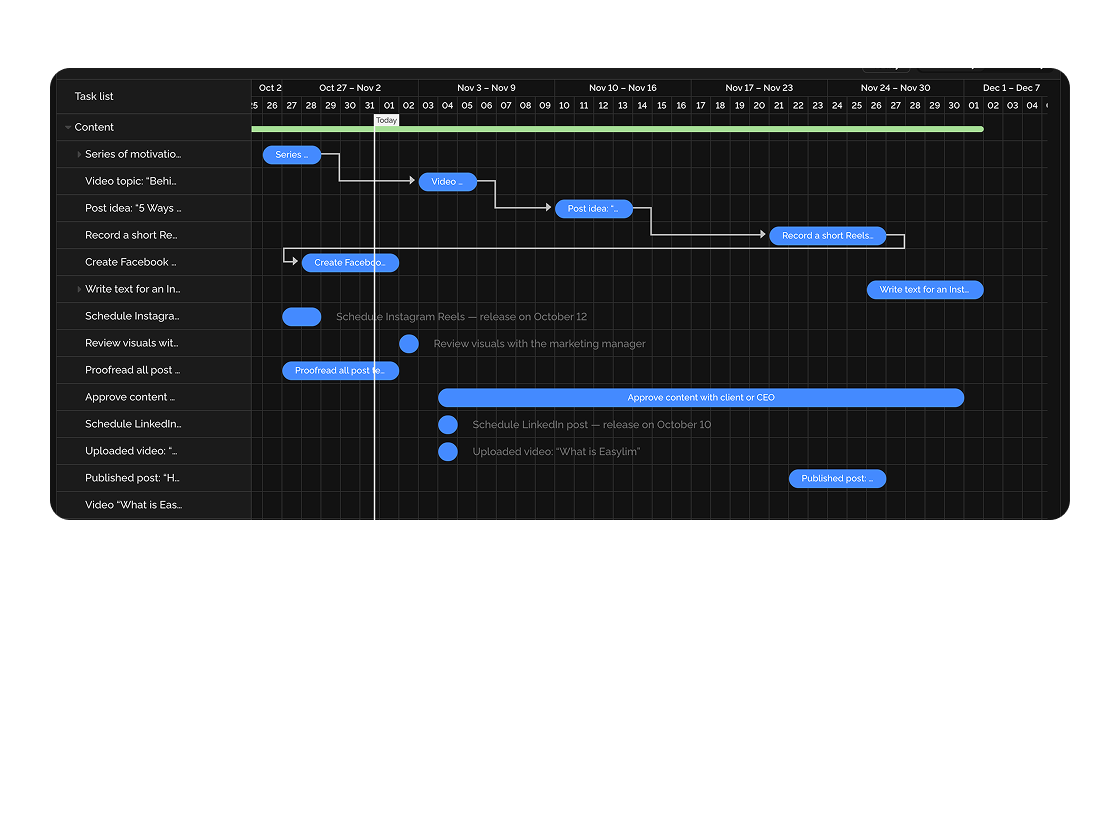
Visually plan projects, monitor progress, and see task dependencies in a single interface.
Built for
By the numbers
6+
months on one screen
customer data
−30%
overdue milestones
Easylim CRM
Drag
all dates editable by mouse
2025 survey
From a strategic plan to daily tasks — manage timelines more conveniently than ever before.
Capability 01
Distribute tasks over time and instantly see the full project picture.
Capability 02
Easily identify which tasks are on track and which are behind schedule.
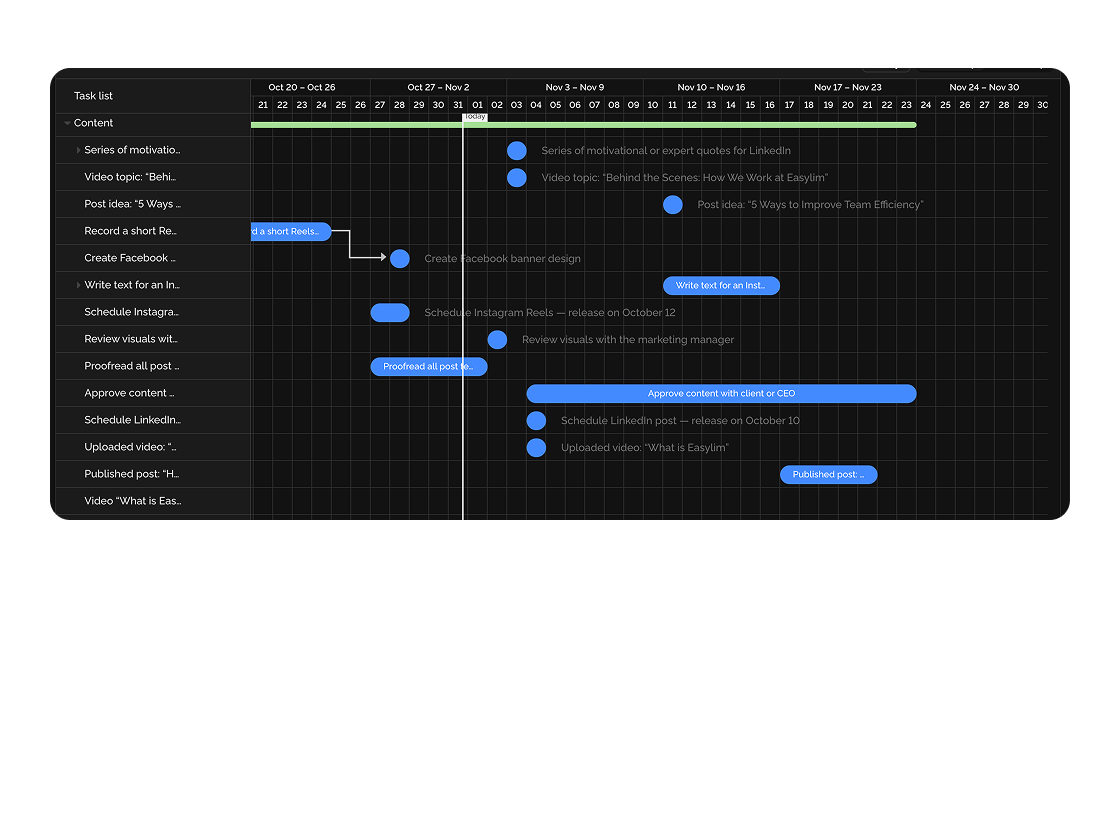
Capability 03
Link tasks together to avoid delays and bottlenecks.
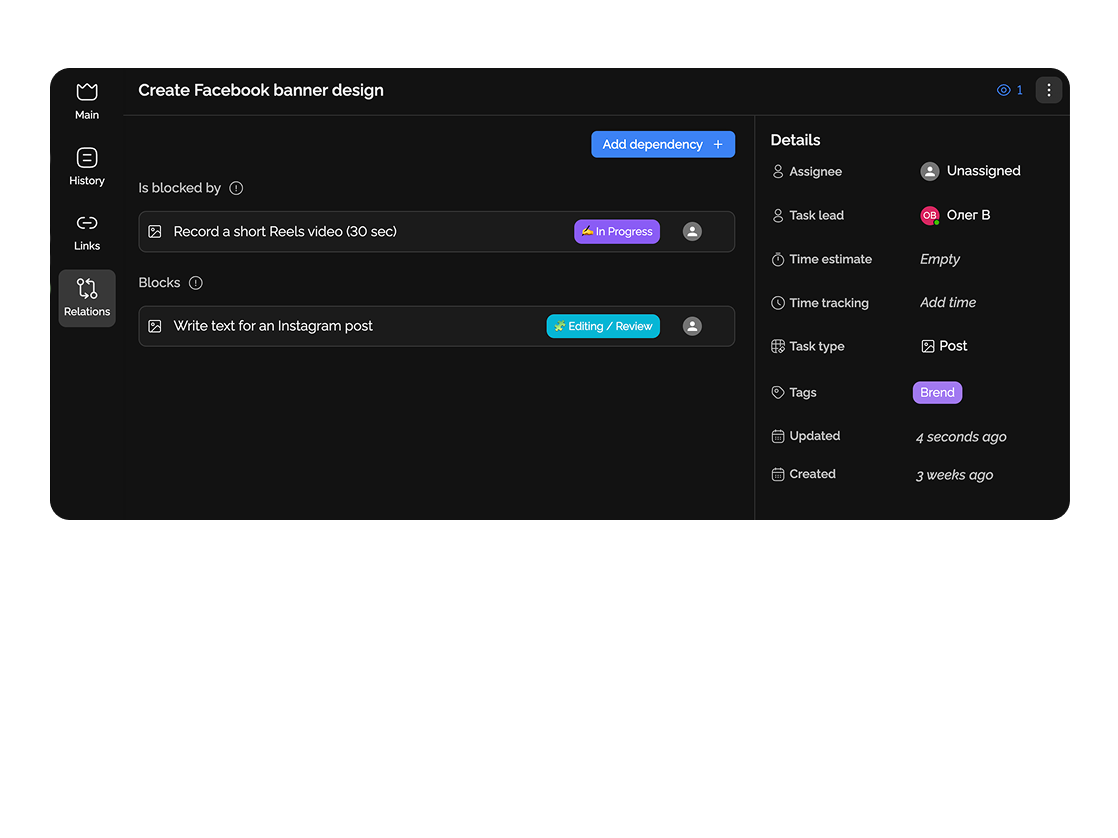
Capability 04
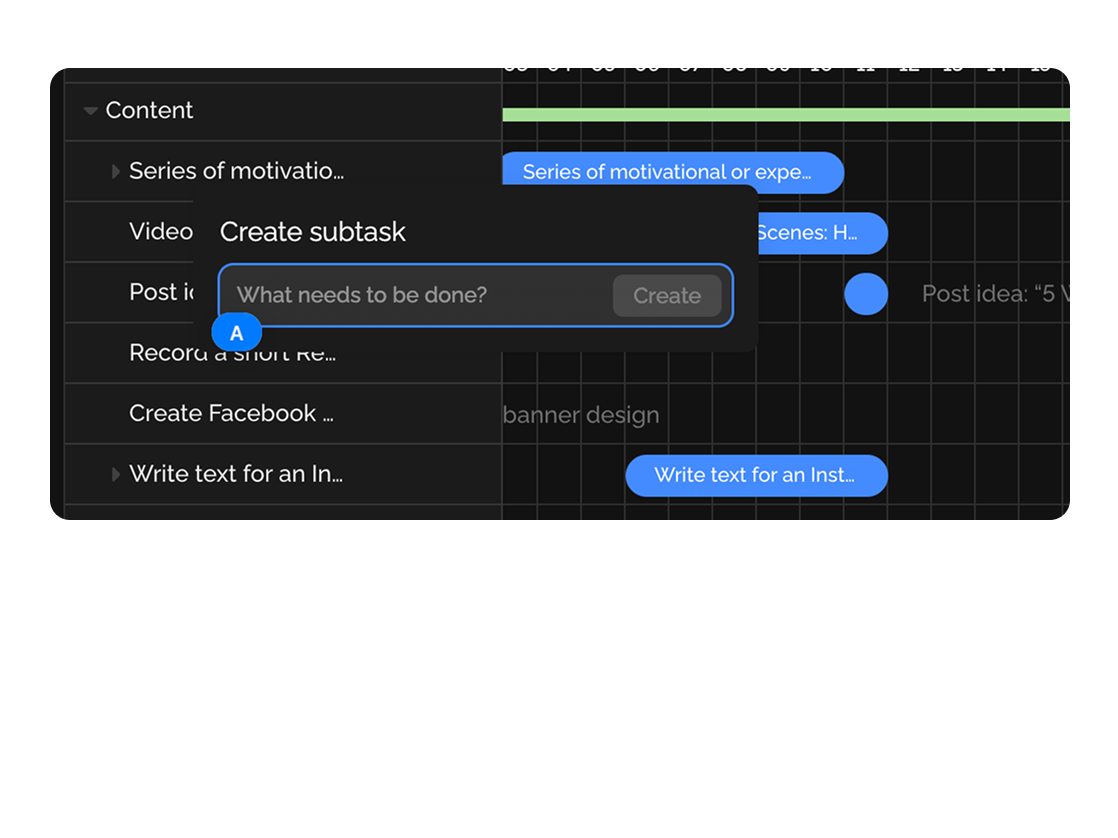
Quickly create subtasks directly in the Gantt chart and set their deadlines.
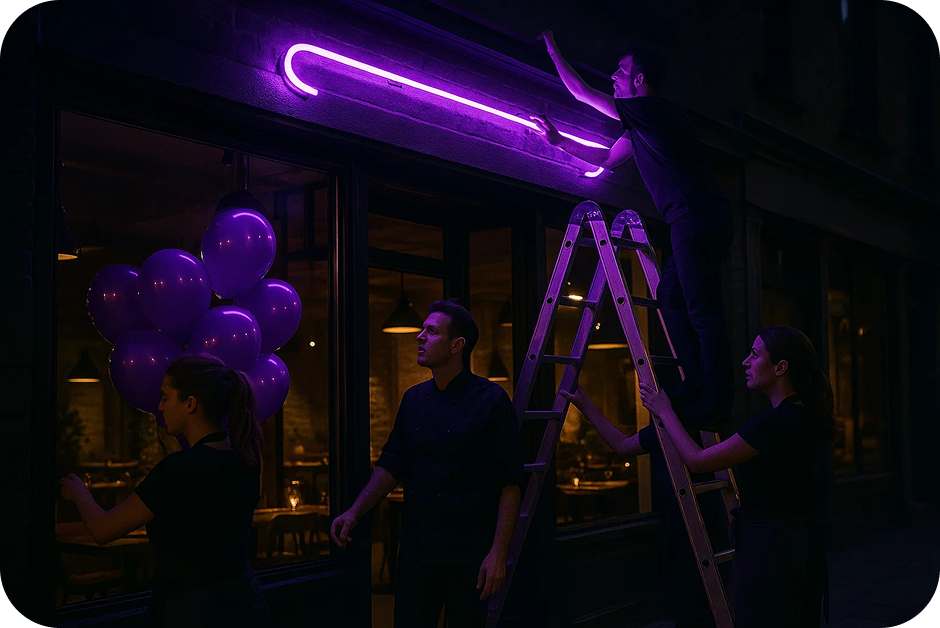
A structured timeline including all stages: finding a location, renovation, equipment purchase, hiring staff, and marketing campaigns. It highlights the critical path and ensures no details are missed.
Plan logistics, booth production, product delivery, material design, hotel bookings, and flights. The chart synchronizes teams across countries.

Deep dive
5 chapters
Gantt looks convincing on a kickoff slide, but three weeks in, 80% of timelines turn into a museum of dates nobody updates. The reason is always the same: too much detail upfront, no real dependencies, and no clear critical path. Here is how to build a Gantt chart in Easylim that the team actually opens daily — not once a quarter when the CEO asks for an "updated plan".
Розділ
A Gantt chart is a horizontal timeline where each task is a bar. The bar's length is duration, its position is start and end, arrows between bars are dependencies. The fundamental difference from Kanban: Kanban shows status ("this is in progress"); Gantt shows status + time ("this is in progress, started May 1, due May 18, QA starts after it").
For projects with hard deadlines and real dependencies, this format is the only one that doesn't lie. Construction, SaaS release planning, event launches, manufacturing cycles — anything where "you can't weld the seams until the metal is delivered" simply isn't compatible with a column-based board.
Easylim renders Gantt as a timeline with 6+ months on one screen, with drag-to-edit dates, draw-by-line dependencies, and automatic highlighting of the critical path — the sequence of tasks that determines the final delivery date. Slip one task on the critical path by two days and the whole project slips two days. Everything else can move without consequences.
Розділ
The worst thing you can do with a Gantt chart is lay out 200 tasks at project kickoff. Within a week half the dates will be wrong, and the team will stop opening the timeline. Work the other way around: start with 5–7 top-level phases (Discovery, Design, Build, QA, Launch), then add detailed tasks only inside the phase you're actively running.
In Easylim, create a project, open the Gantt view, and add the first bar — that's a phase. Drag to set its duration (Discovery: two weeks). Inside the phase, create subtasks directly on the chart — right-click a bar, "add subtask". Child bars automatically group under the parent.
Dependencies are drawn with the mouse: pull a line from the end of one bar to the start of another. Easylim supports 4 types — FS (finish-to-start, the default), SS, FF, SF. For most projects FS is all you need. Once you've got the first 15–20 bars and dependencies in place, turn on critical path highlighting and look at which tasks actually drive your release date.
Discovery
phase 1
Design
phase 2
Build
phase 3
QA
phase 4
Launch
phase 5
Розділ
With the timeline in place, turn on critical path highlighting. Easylim computes the longest chain of dependent tasks and colors it red. If anything on this path slips, your final delivery slips by the same number of days. Anything off the critical path has slack — you can move it without affecting the deadline.
Baseline is a snapshot of the plan at the moment it was approved. Three months in, you compare the current Gantt against the baseline and see which phases drifted and by how many days. Without a baseline you're always living "in the current plan" and never notice you're 6 weeks past the original commitment.
Milestones are zero-duration bars (diamonds on the timeline). Beta release, contract signature, investor demo. Easylim sends notifications N days before a milestone — that's better than remembering by hand. If your project has 30+ tasks and 0 milestones, nobody is actually managing it; you're just maintaining a task list.
Розділ
Monday 10:00 — timeline review (15 minutes). The PM walks through every bar that was supposed to finish last week and checks reality. Two bars — "equipment delivery" and "supplier contract" — slipped by 4 days. The PM drags them on the chart, and Easylim auto-recalculates every dependent bar downstream.
Tuesday — the supplier confirms a new kitchen delivery date, 7 days later. The PM moves the bar and immediately sees: the restaurant opening slips by 7 days, because kitchen delivery is on the critical path. That's a signal to the owner today, not the week before opening.
Wednesday — a new bar is added: "health inspection permit" (originally forgotten). The PM draws a dependency: opening can't start without the permit. Thursday — the electrical subcontractor offers to start 5 days earlier. The PM shifts the bar; the critical path shortens, and opening moves back to the original date.
Friday — baseline comparison. The chart shows 6 of 24 bars drifted more than a week, all in the same phase (procurement). That's the signal that next month deserves a dedicated supplier manager.
Розділ
Gantt earns its weight on projects with a fixed scope and real dependencies. If your team handles a continuous flow of tasks (product team, marketing, support, ops), Gantt will be mostly empty: short bars, few dependencies, no meaningful critical path. Kanban is the right answer — status without time.
Work pinned to specific dates/times (meetings, calls, reminders) → calendar: Gantt is too heavy for "meeting with client Wednesday 3pm". Personal day planning → daily planner with time-blocking and Google Calendar sync.
Large projects combine both formats: Gantt for the 6-month roadmap (used by leadership and key stakeholders), Kanban for the team's daily work (same task set). In Easylim it's the same data — just two views, no migration, no duplication.
one task set · two views
This feature connects to the apps your team already lives in.
More features
No card required. Free tier forever.